Wednesday, December 30, 2015
Sunday, December 13, 2015
PLANETARY LINES - How to forecast supports and resistances
New article: http://archive.aweber.com/awlist3900413/BIjwi/h/Planetary_Lines_Best.htm
Sign up our Free Newsletters to get directly via e-mail every update and article we write.
Sign up our Free Newsletters to get directly via e-mail every update and article we write.
Monday, November 30, 2015
Friday, November 20, 2015
NEW SERVICE! TIMING STRATEGY REPORT - a new CHEAP Service
TIMING STRATEGY REPORT
ANNUAL SUBSCRIPTION
What you need when you are not an intraday Trader!
What you need when you are not an intraday Trader!
S&P500, CORN, SOYBEANS and CRUDE OIL

In 2015 we have done 23 trades so far, with a profit
of 203 points! 11 trades closed in profit and only 1 in loss! This is
the evidence of how our forecast works!
Now we are creating a proper subscription to trade 4 Markets with this approach, for people who cannot follow the Market every day, or are not interested to be very active traders, not need to see charts and studies. We cover: S&P500, Corn, Soybeans and Crude Oil.
The Subscription is Annual, considering the nature of the service there is no sense to do a monthly subscription! Download the example here!
Subscribe Now, the more you wait the more you risk to miss a trend!
Here below the Details:
WHAT IS THE TIMING STRATEGY REPORT?
The Timing Strategy Report is the easiest information we can provide, here there are no studies or charts, with this service we show when our forecast models suggest us to buy or sell, taking in consideration only the most important long-term price structure. We have created this Service because we saw a raising interest in something cheap that says only BUY or SELL, without looking at any price or strategy. This is not the way we personally trade, but Corn and Soybeans Forecast Models gave always amazing results only using this system. We don’t suggest to trade with only a Timing Strategy, but in the last 10 years this method gave every year a profit with Grains. We are using the same method for the S&P500 and Crude Oil where we have a good price structure and forecast model.
FOR WHO IS THE TIMING STRATEGY?
The Timing Strategy Report is for traders or investors that are not interested at all in any kind of strategy and study, they just need to know when to buy or sell, being aware of the fact that there are no stop-loss indications. It can suit to people who use CFD and little amount, and want to take advantage of large swings without caring too much about having a position in loss for a while.
FOR WHICH MARKETS DO WE PROVIDE THE TIMING STRATEGY?
We provide a Timing Strategy only for Markets where we have a reliable forecast, it means a forecast that statistically has proved to work. These Markets are: S&P500, Soybeans, Corn and Crude Oil.
Please be aware this is only a forecast approach!
Best Regards,
I Am in Wall Street Ltd Team
e-mail: info@iaminwallstreet.com
Skype: I Am in Wall Street
www.iaminwallstreet.com
High Probability Trading Techniques - S&P500, Crude Oil, Gold, Corn, Soybeans, Forex, Stocks and S&P/ASX 200
DISCLAIMER
It should not be assumed that the methods, techniques, strategies or indicators presented by e-mail, e-book, blog or files will be profitable or that they will not result in losses. There is no assurance that the strategies and methods presented in here will be successful for you. Past results are not necessarily indicative of future performance. The examples presented here are for educational purposes only. The data used is believed to be from reliable sources but cannot be guaranteed. The methods presented are not solicitations of any order to buy or sell. The author, publisher, and all affiliates assume no responsibility for your trading results, and will not be liable for any loss, damage or liability directly or indirectly caused by the usage of this material. There is considerable risk of loss in Futures, Stock and Options trading. You should only use risk capital in all such endeavours.
Monday, November 9, 2015
2016 US DOLLAR FORECAST
The 2015 was the first year where we provided the US Dollar Forecast, and we did it for free. Considering we think that our US Dollar Forecast works statistically pretty well, we are now selling it with a very low price, affordable to anyone interested to it. One reason why we sell the US Dollar forecast at this low price is because we usually don’t trade this market, we are not focused on it during the year, but we can provide only a yearly forecast, which is good but not always precise. As always, I let you judge our work showing you the results we had in the past with the same forecast model, so you can decide on your own if our work can meet your needs and what you can expect from our work, based on a statistic. Here below you can see the results of our Forecast Model from the 2010 till now:

To see the forecast of 2015 till the end of the year, please CLICK HERE to download the free 2015 US Dollar forecast.
Now it is possible to pay with PAYPAL!

Best Regards,
I Am in Wall Street Ltd Team
e-mail: info@iaminwallstreet.com
Skype: I Am in Wall Street
High Probability Trading Techniques - S&P500, Crude Oil, Gold, Corn, Soybeans, FOREX, Stocks and S&P/ASX 200
2015 CORN & SOYBEANS FORECAST BULLETIN REVIEW
To describe how was the 2015 Grains Bulletin, one chart is worth 1000 words:


Just lucky? We have been able to forecast the most important trends for two years in a row:


The
Soybeans PFS Forecast Model was made in October 2014, and it is
unbelievable how it was able to suggest always the most important trends
over the year. And we have not been just lucky, because our forecast
was great also in the 2014 Grains
Bulletin.
You have now the opportunity to judge by yourself if it can be worth to order the new 2016 Grains Bulletin, you can have the opportunity to know in advance which trend to follow with a very high
probability of success, because good profits are always made following the main trend.
This is what I wrote in the 2015 Grains Bulletin in October 2014, Soybeans section:
- January should be a weak or sideways month, no important movements, I would stay FLAT.
- If we see a strong up movement in January, the Market should push down immediately in February. Plus, if we do see a quite strong up push in January, it is probable that we will see a quite negative trend over the year.
- The best moment to buy should be in February, where the PFS suggests to buy at the end of February, but the uptrend could start even before that. We will pay attention to it following the most important prices over the year.
- So, the uptrend should start in February and March/April should be months where we see higher levels.
- An intermediate High arrives in the second half of March or in April.
- Then down into May. May should be a Low and a strong buying opportunity for quite a strong up movement that should lead Soybeans into the Summer.
- After this uptrend, Soybeans does a High between June and August. It’s not easy at the moment to be more precise, let’s say that I would prefer to see the High in June/July and the downtrend should start in July. At the moment it looks to be the best month to open SHORT positions.
- The new downtrend from July should push down till October/November, where a new bottom phase is expected, with low volatility.
- In November we should see also the beginning of a new little uptrend till the end of the year.
Reading the comment, you can see it was not easy between February and April, where I was expecting an up push that never arrived, but then we were expecting a descent from April till May and then strong up... and everything was just perfect, like the top in July and the descent till October.
2015 CORN REVIEW
The Corn section was similar, considering these two Markets move usually in a similar way. Here you can see as well how the
forecast we made one year in advance was great, reading what we said in October 2014:
- The first buy opportunity is, in my opinion, in February, where a new uptrend should start.
- The uptrend can work till March or April, where a new descent or sideways phase can start till May.
- May should be a new buying opportunity, above all if it turns out to be a Low. The up push from May should last till July, a possible High. The High can be done also in June or August, but July is my favorite month.
- From July a new downtrend should start, working till autumn…
Read with attention what I said and look at the Market, you will find out how the forecast was just perfect!

The forecast was great, and again, the
hard work had been rewarded. The strong up push you see in September is
not real, this is only because of the change of the Contract using the
Spot Chart of Corn.

Are
you aware of what it means when you know which trend we have to follow
for weeks? It means that you can make 100 and more points of profits.
One Future Contract is 50 points per 1 point... you are good in math,
right?
The new 2016 Corn and
Soybeans Forecast Bulletin is now available. Plus, we are adding the
Wheat Market to be able to provide analysis on this Market from January.
Every 2-3 months we send updates to give more precise details about how
to trade the forecast and which prices we should use.
The
new 2016 Corn and Soybeans Forecast Bulletin is now available. Plus, we
are adding the Wheat Market to be able to provide analysis on this
Market
from January. Every 2-3 months we send updates to give more precise
details about how to trade the forecast and which prices we should use.
Now it is possible to pay with PAYPAL!
Best Regards,
I Am in Wall Street Ltd Team
e-mail: info@iaminwallstreet.com
Skype: I Am in Wall Street
High Probability Trading Techniques - S&P500, Crude Oil, Gold, Corn, Soybeans, FOREX, Stocks and S&P/ASX 200
Monday, October 12, 2015
New Profits with S&P500 and Crude Oil
While grains are sleeping, we keep doing profits with
S&P500 & CRUDE OIL
S&P500 & CRUDE OIL
Corn and Soybeans remain sideways, stuck in a trading range. Also Wheat is not doing big movements, but if you read the Newsletter I sent on the 8th of June, you can see it was still possible to make good profits.
CRUDE
OIL
If
you followed the previous Newsletters, you know we bought exactly at
38, a great trade that makes us following a strong uptrend, and we are
still LONG, but not for long. Actually we are planning to close the
position using a precise strategy. What is unbelievable is how we did say in January that the level at 38 was a storng buy opportunity. Well, now Crude Oil is at
49!
Here is the chart, where you can see the profit of 11 points that we are doing.
Our next question is: was our study useful for you if you knew it?
S&P500
After
the strong descent we saw in August, how did we handle the Market? It
was very volatile, not easy to trade, but we said to our customers that
in our opinion the fall was a new strong buy opportunity, only a scaring
movement, nothing more.
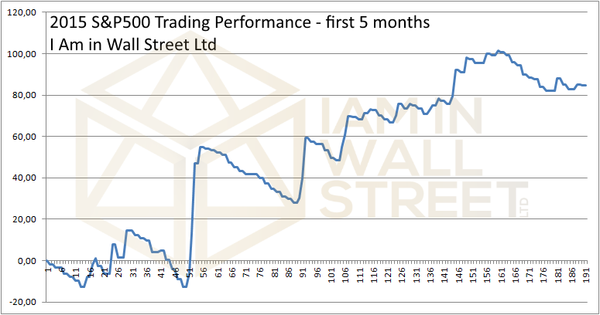
You can see the results of our strategy, following precisely the
indications of our Daily Reports:

Yes, we had to fight a lot during the
choppy Market in September, and if you read the previous Newsletter you
can see that we were expecting the descent till Agust/September and
then... obviously up. Well, in the last trade, we bought around 1900 and
we are still LONG, Futures of the S&P500 closing on Friday at 2007
Points, great trade, over 100 Points. You can see the profit we did in
our Performance Chart, here above.
Since the beginning of the year, our precise strategy is in profit of 220 points, a great result so far.
We
also have a End of Day Strategy for people that cannot follow
the Market in intraday or people that don't want to be too active in the
Market, and also with this strategy we are doing great, where we use
only the most important supports/resistances and forecasts. The last 7
trades have been all in profit.

All our strategies are precise and planned in advance or in real time. The proof of this is in the book "How to Trade to Make Profits",
written by Daniele Prandelli, where you can see all the trades made in a
real money account following the strategies of our Service, with a
final performance of +58%.

What
is next? Let's say we should not be scared to buy... but there is
always a strategy behind every forecast, because we are not that stupid
to buy without understanding that we can also be wrong, no one knows
where the Market is going, never forget that, NO ONE!
In about 1 month will be issued the new 2016 Bulletin for the S&P500, Soybeans and
Corn.
In
the next Newsletter I will provide a deep Review about the work we did
in Grains and S&P500, showing also the 2015 Bulletins and the
updates and Forecasts we sent out over the year.
If
you want a complete support and analysis about the Market we
study, subscribe our Service, to know the most favourite trend of the
Market, and which strategy we are going to use to make profits.
If
you are a professional trader or investor, you should have a look at
our work, it can really improve the analysis and the results of your
work, we have Banks following our studies
too.
Best Regards,
Daniele Prandelli
I Am in Wall Street Ltd Team
e-mail: info@iaminwallstreet.com
Skype: I Am in Wall Street
High Probability Trading Techniques - S&P500, Crude Oil, Gold, Corn, Soybeans, FOREX, Stocks and S&P/ASX 200
Tuesday, September 1, 2015
1st of September Newsletter - S&P500 and Crude Oil
CRUDE OIL
Since January I'm saying that in case of new Lows, we have to wait for area
38, next target and very important price area. For example, in the first Weekly Report of the year, I said:
"I will turn LONG only after a movement above 57.40, or in case of the exceptional event of a movement till area 38".
We kept saying this, and finally, Crude Oil reached area 38 on the 24th
of August. We used the Key Price at 37.98 (because of intraday studies)
to open LONG positions, and after only one week, we have a profit of
more than 10 points!!! Crude Oil now at 48.60!!!
On the 24th of August
we bought above 37.98, this was the strategy we wrote in the Daily Report: "If CL tests 39.06 or 37.98, always LONG above them and FLAT under them". CL tested the level 37.98, and the strategy was perfect
Someone
thinks that our service it soo expensive... one CL contract at 38 and
in one week we made +10.000 USD. Our service is really cheap compared to
the value of the info we
provide.
S&P500

Also the forecast we made one year in advance looks great, this is what we said in the 2015 S&P500 Bulletin:
- March is a month where to buy.
- The general uptrend should go on till July, where it is possible we see a stop of the uptrend.
- Little descent till August or September, and then XXX...
Look at the chart, don't you think this was a great forecast, considering
we did it one year in advance?
Summing
up, August has been probably the most profitable month of the year,
volatility is always very dangerous, but it can give you also huge
profits. If you know where to look, as we did, you can take advantage of
strong movements.
What's next? Subscribe our service to know in advance the most favourite trend!
Now it is possible to pay with PAYPAL!
You can read the previous Newsletters following this link: http://archive.aweber.com/awlist3900413
Best Regards,
I Am in Wall Street Ltd Team
e-mail: info@iaminwallstreet.com
Skype: I Am in Wall Street
High Probability Trading Techniques - S&P500, Crude Oil, Gold, Corn, Soybeans, FOREX, Stocks and S&P/ASX
200
Tuesday, August 4, 2015
Tuesday, July 7, 2015
From the 6 of July Free Newsletter
It is time FOR YOU to judge if our
service is useful!
After one month, you can read the previous Newsletters and see what I was suggesting about Sugar, Wheat (and Corn-Soybeans of consequence). This is why people are happy to pay for this service!
Great Forecast in the Wheat Market:

Great call in the Sugar Market, so far...

And if we were expecting a strong up push for Wheat, we were expecting about the same in the other grains Marekts. In our Reports we took profits following the up push in Corn and Soybean, we did actually forecast the up push in June:


Now it is possible to pay with PAYPAL!

You can read the previous Newsletters following this link: http://archive.aweber.com/awlist3900413
After one month, you can read the previous Newsletters and see what I was suggesting about Sugar, Wheat (and Corn-Soybeans of consequence). This is why people are happy to pay for this service!
Great call in the Sugar Market, so far...
And if we were expecting a strong up push for Wheat, we were expecting about the same in the other grains Marekts. In our Reports we took profits following the up push in Corn and Soybean, we did actually forecast the up push in June:
What's next? Subscribe our service to know in advance the most favourite next trend!
Now it is possible to pay with PAYPAL!
On
the 13th of July the Subscription Fees will be increased, if you
subscribe before the end of the week, you will keep the same price for
the next years!
Why do we have decided to increase the Fees Subscription?
Because
we are providing a high-value service, and after many years Daniele
Prandelli has proved without any doubt the value of our studies. Also,
we sell information that can
bring 50 times the value of the cost of our service, and the increase of
the Fees is just a normal process for something that is giving good
opportunities of profits. We proved it also with these simple
newsletters in just one month.
Best Regards,
I Am in Wall Street Ltd Team
e-mail: info@iaminwallstreet.com
Skype: I Am in Wall Street
High Probability Trading Techniques - S&P500, Crude Oil, Gold, Corn, Soybeans, FOREX, Stocks and S&P/ASX
200
Thursday, June 11, 2015
From the 8 of June Free Weekly Newsletter
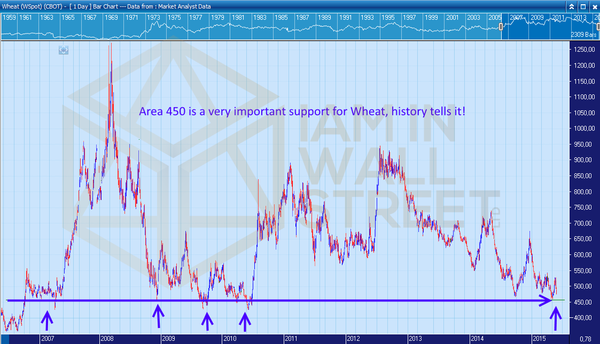
WHEAT
You
have already reveived the US Dollar forecast and, as you can see, it is
suggesting a general pullback. We are waiting for this movement and it
should support our view about other important Markets, like commodities,
that have been affected my the strenght of the USD.
Today
we have a look at one new Market we are introducing in our Report
Service: Wheat. We think there is a good opportunity for a new uptrend
in this Market, even if it can remain sideways for a while. This simple
chart shows something important:
|
Working
with
grains means often working with horizontal prices, and here we have an
example. Because of many factors, we see Wheat being in a very good
position in terms of a risk/reward. We published this Chart a few weeks
ago, I let you have a look to Wheat, ours was not a bad call!
S&P500
The
S&P500 is one of the most important Markets we trade with our
Report Service. We only want to share with you a simple fact: why are we
sorrounded by people calling a crash since 2012? Every week we can see
someone saying: a sharp decline is natural now... we are close to a new
crash... the Stock Market cannot sustain this uptrend for any longer...
But
you see, now is 2015, and the S&P500 is still up! Why we cannot
think right in the opposite way people do: the trend is evidently up,
let's follow it, not fighting it!
Even
if our forecast is not expecting any crash NOW, we have precise prices
that help us to understand when the uptrend will be over. In 2015, so
far, 80% or our trades have been LONG positions:
|
Best Regards
Daniele Prandelli
e-mail: info@iaminwallstreet.com
Skype:
I Am in Wall Street
High Probability Trading Techniques - S&P500, Crude Oil, Gold, Corn, Soybeans, FOREX, Stocks and S&P/ASX
200
Thursday, May 21, 2015
What did I say in my Daily Report Service today about Crude Oil?
Possible up push today... Crude Oil +3% so far...
Monday, May 11, 2015
While the S&P500 remains sideways... we keep making profits!
You know, we have only one purpose in what we do here: making profits!
So, while Corn and Soybeans remain very flat, Gold always around the same prices, and the S&P500 moving in a narrow range, we adapted our strategy to the Market conditions, and with a precise work on the Key Prices, we keep having new profits!

 A performance that keeps working since 2012!
Also with Crude Oil we are doing very well, we have been able to buy around 44 and selling around 54! We are now LONG again!


Also with Crude Oil we are doing very well, we have been able to buy around 44 and selling around 54! We are now LONG again!
Subscribe to:
Posts (Atom)